Thursday, February 10, 2011

What Kind of Stop-Loss Order Should a Trader Use?


In this article we will discuss the various ways to implement a stop loss order. Every trader who has had dealings in any of the financial markets is familiar with placing and executing a stop loss order, but many are mistaken that a stop loss order is always numerical. On the contrary, there are many traders (even professional hedge fund managers) who use what is colloquially termed a “mental stop” which stop is a stop loss point determined by factors other than the price, such as events, volatility, volume, option positioning, or any other comparable data. Such a stop is no less valid than a numerical one, and certainly no less effective, but one does need a lot more discipline to execute it successfully.
The great advantage of a non-numerical stop-loss order is its partial immunity to price swings. If the trader has confidence in his analysis, and is satisfied that standing firm in the face of market volatility is sensible and acceptable given the major dynamics and currents in the market, maintaining positions with non-numerical stop loss orders can be advisable and lucrative. In order to manage the inevitable large swings in account value, professional managers will implement hedging strategies in addition to money management methods, to control and minimize the volatility of the portfolio. Thus, even if the mental stop triggers a large drawndown in our position, we can minimize the effect on the portfolio through diversifying and distributing the risk among various currency pairs.
Let us examine the various ways of implementing a stop-loss order now.

Equity Stop

An equity stop is one where the position will be closed in case the total equity in an account falls below a certain value. A stop loss at 2 percent of total equity is generally regarded as a conservative strategy, while the maximum is 5 percent for most money management methods. Thus, to give an example, a 1000 USD account would have the stop loss for an open position at the point where to the total equity would fall below 980 USD.
Both the disadvantage, and the advantage of the equity stop is its inflexibility. The equity stop provides a very solid criterion for deciding on the success or failure of a single trade, as there’s no way of being mistaken about an account in the red. On the other hand, the same inflexibility may prevent the trade from functioning as expected. The markets are volatile, and a trade that has a perfectly valid cause behind it may yet be invalidated by the random fluctuations that are not predictable.
Another important problem with the equity stop is its inability to prevent a string of losses. For instance, when the trader closes a position at a two percent loss, there’s nothing that will prevent him from opening another position in the same direction (buy or sell) a short while later, if the causes that justified the first trade are still in place. For instance, if the trader enters a sell order when the RSI is above 80, and consequently the stop loss is triggered, and the position closed, there’s little that will prevent the same events from being repeated if the price action repeats the same movements. In order to avoid this pitfall, the trader can tie the stop loss point to a non-price factor, and the rest of this article discusses such scenarios.

Chart Stop

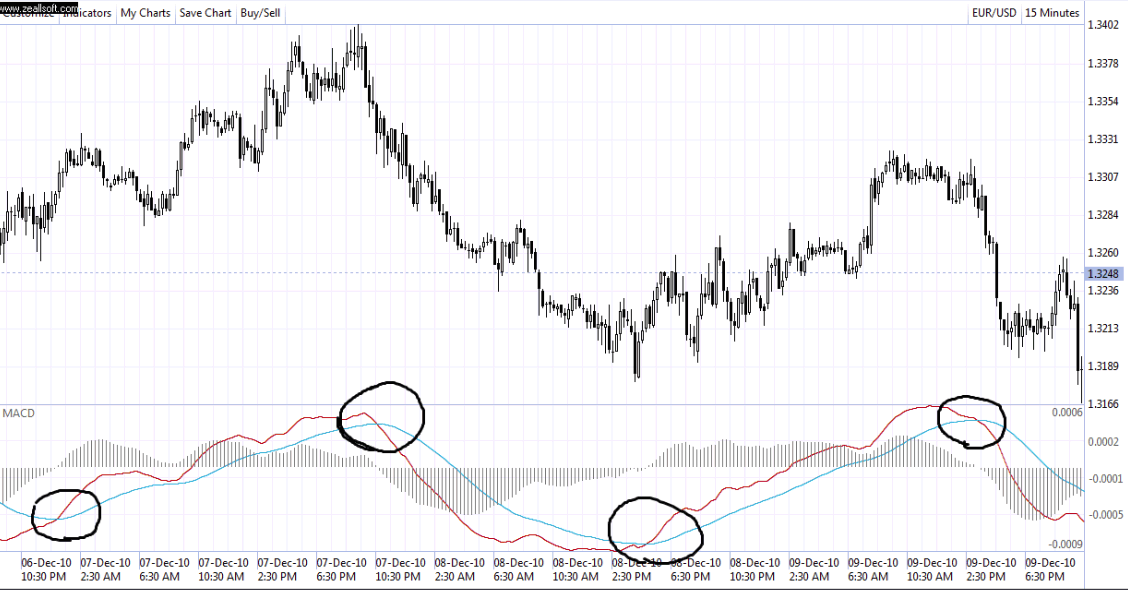
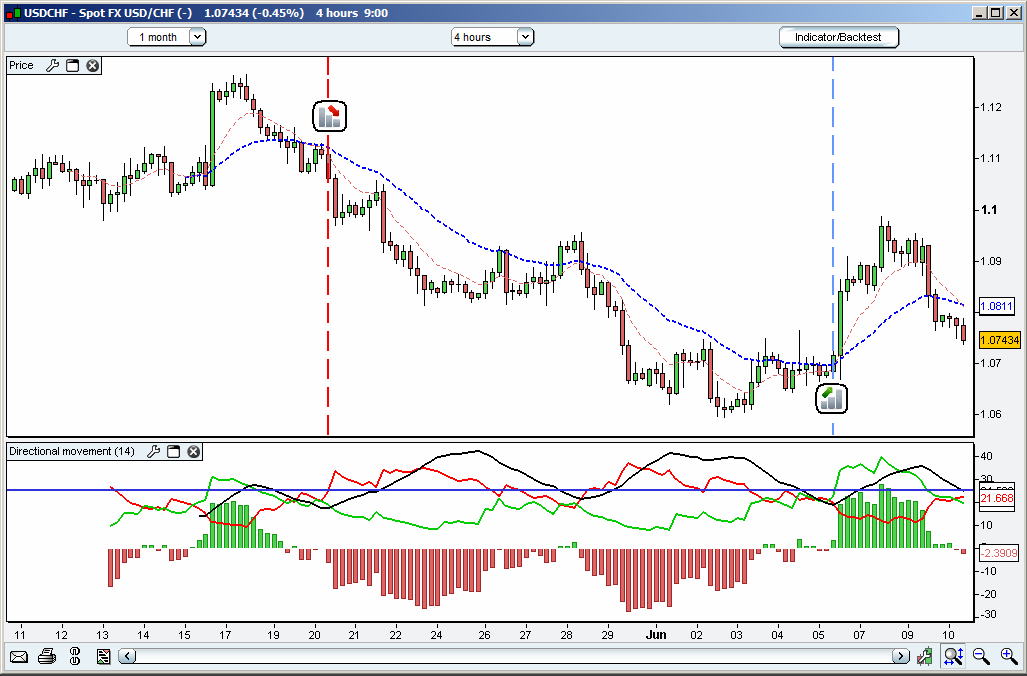
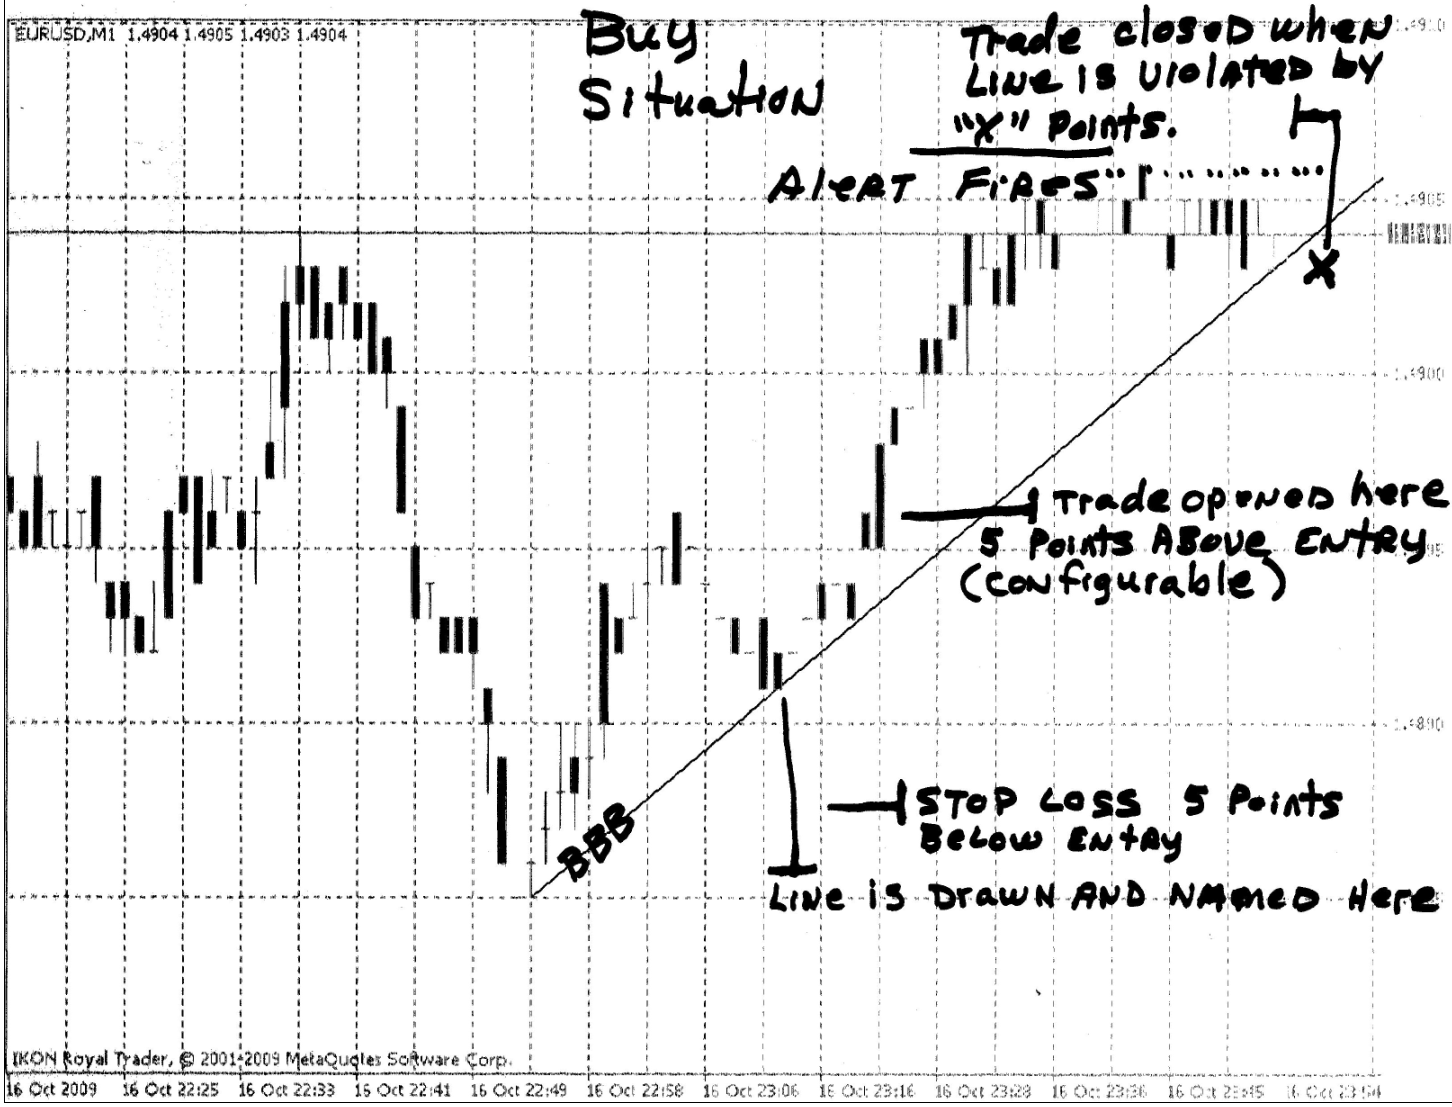
In a chart stop, the trader will place the stop loss order not at a price point, but at a chart point which may be static or dynamic. For instance, a stop loss order may be placed at a fibonacci level, which would be a static value. On the other hand, the trader may use an API (an automated trading system), or mentally prepare himself to close the position if a technical event, such as a crossover, a breakout, or divergence occurs, which would constitute a dynamic stop-loss point. In all these cases, technical analysis generates the triggers and determines the price where the position must be closed.
The chart stop is more flexible and reliable than a direct equity stop, because it adjusts to price action and volatility, and is therefore somewhat independent of the random movements of the price. The problem with the chart stop is twofold. First, the technical indicator used to generate the signals may fail to capture the change of the market trend, resulting in large losses. The other, and obvious problem is related to the indirect character of the stop-loss mechanism. Because the order is independent of the price, it may not be able to cut losses as effectively as a direct equity stop, and larger than expected losses may materialize as a result

Volatility Stop

A volatility stop depends on volatility indicators, such as the VIX for determining the exit point for the trade. As such, market panics and shocks will cause the order to be executed, but mere price fluctuations in the currency market which lack their counterpart in other asset classes will be ignored for the most part. The trader who utilizes a volatility stop expresses the opinion that unless a major, unexpected shock hits the market, his position should be held regardless of the behavior of the markets. This is a more risky strategy than the equity stop, but can be profitable and valid depending on market conditions and the economic environment. In general, it is doubtful that a volatility stop can be very useful in a very nervous and volatile market. But it could be very helpful in maintaining a long-term position where risk perception is low.
The volatility stop is sensitive to prices, but only in an indirect manner, and its nature is similar to the chart stop. It is useful for eliminating very short term distortions from our analysis, and allows us greater resilience in the face of noise in the data.
Volatility may fail to react to market swings. Sometimes a large fall in the market has no equivalent rise in the various volatility gauges. Similarly, volatility can at times rise without any obvious corresponding price action. Consequently, a volatility stop (and similar stops based on non-price data) can be triggered even before a trade is in the red. All these must be kept in mind if the trader decides to use this type of stop order.

Volume Stop


When the trader expects an ongoing trend to be reversed or invalidated subsequent to a change in volume, a volume stop maybe appropriate. While volume statistics are not available for the forex market, positioning as depicted by the COT report can be used for establishing this type of stop. For utilizing the order, the trader determines a percentage value on futures positioning above or below which the position must be liquidated, depending on market conditions and the nature of the order. In the same context, other types of data can also be used to generate a stop loss trigger point. A particular put/call ratio, or option risk reversal value may all be chosen to provide the equivalent of a volume stop in the stock market.
In example, let’s consider a trader who opens a short position in a carry trader pair, confirming his trade by developments in the stock market. His expectation is that the recent rise in the stock market indexes (and the corresponding rise in the carry pairs) occurred on low volume, and will soon be reversed in the absence of new money flows. Consequently, he places his stop-loss at a volume level which, if reached in a rising market, will invalidate the starting premise, and cause the position to be liquidated. When this occurs, and volume rises above the preconceived level, the trader will close his short position in the carry trade pair.

Margin Stop

The margin stop is not really a stop loss order, but the absence of it. In this case the trader will let his account absorb the unrealized losses until a margin call is triggered, and a large part of the account is gone. The margin stop is a sign of indiscipline and lack of insight, because a diligent trader will always predetermine the conditions that will lead to the closing and liquidation of a position. Since not even the brightest analyst is capable of predicting the future with any certainty, lack of a stop loss order is an indefensible practice.
Notwithstanding the previous, the margin stop is a popular choice among many traders who are unable to remain calm in the face of the great emotional pressures of trading. It is only viable under really low leverage such as 2:1, and even then a margin stop would not be the best choice. At much higher leverage, the margin stop is completely indefensible, and should be avoided altogether

Event Stop

Fundamental analysts do make use of technical tools, if only for determining the trigger points for a trade. Take profit, and stop loss orders are used by almost every trader in the world, and its is unthinkable that a serious analyst will not have a condition, at least in mind, for closing an open position, however convinced he may be of its ultimate validity.
But fundamental analysts are not limited to technical tools and the price action for determining when to exit a trade. The event stop that we would like to discuss here is a tool that the trader can use to determine a trade’s exit point.
When using the event stop, the trader will ignore the price action for the most part (and will use low leverage), and will only close a position in the red when the scenario he had pictured in his mind becomes contradicted by events. For instance, a trader is anticipating that Bank A will be nationalized by the authorities of Nation X, and he expects that this will lead to X’s currency depreciating against its counterparts. In consequence, he shorts it. He will refuse to close the position until authorities confirm and clarify, in a solid and unmistakable fashion, that they will refuse to nationalize Bank A. In the meantime, he will be willing to put up with all the rumors, extreme swings, and short term fluctuations in the market without worrying about the unrealized profit or loss in his account.

As we mentioned at the beginning, the event stop is for those traders who know what they do, and who possess the track record, the intellectual background, and the confidence to use it. But do not take our word in order to evaluate your own skills; you should know yourself better than anybody else, and if you believe that you understand the economic dynamics of the era, and can defend your claim in your trading activities, you will be perfectly capable of using the event stop.

Conclusion

The best choice for the beginner is the equity stop. During the learning process, the trader can concentrate on bettering his understanding of the markets without worrying about excessive losses. Once the trader gains a good understanding of market dynamics, and is able to form and implement his trading plans, the equity stop will quickly lose its attractiveness.
The best method for using the non-price stop orders is combining them with a wide equity stop which will serve as a final safety precaution in case the price action becomes too dangerous. For instance, a trader can long the EUR/JPY pair and hold it indefinitely until the VIX registers a value above 35, where a v9olatility stop would be placed. At the same time he will protect himself from extreme, and unexpected swings by placing an equity stop at 5-7 percent of total equity. Thus, unless a very large price swing completely overruns the main criterion for the stop loss order, and triggers the equity stop, the trade would be maintained indefinitely.
Needless to say, every trader will have his own choices on stop loss orders. And we would like to conclude this section by noting that the key to a successful stop-loss order is a disciplined risk management strategy, and everything else is just detail.


Predicting Market Extremes Using the Put/Call Ratio

Options have long been popular with forex traders for hedging, for directional bets, maximizing profit or for more complex strategies that are out of the scope of this article, but over the years, the record of options trading for buyers has not been stellar exactly. Predicting market direction in a specific time frame is always a difficult endeavor, and when the options trader must make those predictions in strict adherence to the terms of the options contract, the chances of success plummet. About 90 percent of option buyers eventually lose money, in sad testimonial to the difficulty of market timing.

Option writers have been increasing the types of available contracts to satisfy the hunger of the crowd for these instruments, and if not for the recent economic crisis, the volume and diversification in this market would certainly have continued to accelerate. In spite of all that, the basic puts and calls remain the most popular tools for the trader who desires to try his luck in this field, and there’s always a great deal of demand for the ever increasing supply coming from option brokers.
The attractiveness of various types of options to the trader mostly arises from the limited nature of the risk. For instance, a stock trader who shorts the firm X will face unlimited losses if the firm’s price moves in the other direction, but if he simply buys a sell-option on the firm’s stock, the maximum amount he could lose will be limited by the value of the contract ( in the same case, the option writer’s risk is unlimited, in theory). But that aside, there’s no reason to think that on a basic level options trading is any different from spot trading, and the similar nature of the spot forex market to the options market will be the basis of our market predictions.
Before examining the nature of the put/call ratio, and its significance for forex, let us remember that a put option is a contract that allows the buyer to sell an underlying asset at a specified price, and a call option is the kind which allows the buyer to buy the underlying asset. Thus, a buyer of the call option is expressing a view that the price will be higher at a specific point in the future, while the buyer of the put option believes that the price of the underlying asset will fall.
Now, what happens when euphoria (or panic) overtakes a market , and a bubble is created, as spot traders of any asset flock to grab a share of some security or futures contract on which options are available? How will the options trader’s reaction to the bubble be? Of course, the option trader is no different from the spot trader, and the bubble in the spot market has its mirror image in the options market as well. In other words, it is possible to identify extreme values in the spot market by looking at how ebullient option traders are, and the put/call ratio is utilized in a contrarian fashion to identify and exploit these extreme values for profit.
As most of us know, a contrarian strategy focuses on finding undervalued or overvalued assets in a market, and betting against the market in those assets to exploit the correction that will inevitably occur. It is always possible to define oversold or overbought values on the raw price data, and to make counter-trend wagers on that basis, but the highly volatile nature of the forex market makes this a relatively risky effort. That is why the trader always attempts to confirm his positioning with reference to more than one type of data, and with the volume data gained through the usage of the COT report, and the put/call ratio options market extremes can help traders identify opportunities in the spot market. We calculate the put/call ratio by dividing the total amount of puts by the amount of calls and on that basis get a value that reflects the bias of the market. For example, if there are 24000 put options on EUR/USD, and 60000 call options, the put/call ratio would be 0.4 implying a bullish market. The put/call ratio will rise as sellers drive the trend, and it will fall as the buyers are more numerous. As positioning reaches extreme values, so will the put/call ratio, until a point is reached where the drivers of the bubble are exhausted, which is usually followed by a violent collapse. We can identify the values registered during past collapses, and by comparing the value of the put/call ratio with past data, we can gain an idea on the market direction in the near future.
Trading the put/call ratio depends on identify the put/call values registered during past price extremes, and comparing that with today’s values, as we mentioned before. If a breakout or spike is not confirmed by an equivalent change in positioning in the options market, we will be reluctant to act in the direction of the trend. Such a situation would signify that options traders are not convinced by the action in the spot, and do not believe that it will lead to a sustainable price action. Since many speculative deals in the spot market are hedged in the options market, lack of a confirming movement could suggest that the price action is driven by less-informed, smaller players. For contrarian trades, we will take note of extreme values in options positioning, and will enter counter-trend orders in anticipation of the collapse. This method is really straightforward, allowing the trader ease of mind and clarity of analysis.
Let us also remember two of the difficulties which this method poses for the trader.
1. Needless to say, the definition of extreme value is arbitrary, and there’s no way of knowing which of the previous peaks will hold, or if a new peak in the put/call ratio will be registered as a result of market action. This means that the trader should be cautious about using options market data for the exact timing of market reversals. There’s no magical quality to the put/call ratio, since quite often option traders also trade the spot market in forex, for the reasons mentioned at the top of this article.
2. Options traders are just trader, and there’s no reason to expect to be any smarter than spot dealers. Indeed, studies show that, if anything, they are more likely to suffer losses as a result of directional bets.
We conclude this section by noting that the data on put/call ratios, and trader positioning can be obtained from the CBOT website.


Wednesday, February 9, 2011

Trading the News Releases

News and economic data are the main drivers of market developments, but in a little different way than many traders think. While many novice traders expect important economic events and news releases to be reflected on the price immediately, complain about the irrationality of the market when that doesn’t occur and protest that trading the news is not possible, in fact it is possible, and extremely lucrative in the long term, if one is willing to wait for the payback to arrive. In this article we will take a look at various data types, and attempt to classify them according to a few basic criteria. We will also try to explain how news releases determine market prices in the long term, especially those of greater value and impact on the market. Finally, we will say a couple of word on short term news trading, and how this could be achieved on the basis
In the US most major news releases occur between 8:30 am and 10 am New York time, and consequently trading is also most active and volatile in this period. Option expiries, and market openings take place during this period also, when traders are busy at their desks absorbing and evaluating overnight data, attempting to place all the developments in a general context for usage later in the day. Since volatility is so high in this period, the profit/loss potential is also the highest. It is obvious that proper risk controls and money management techniques will play a major role in our trading method, if we want to avoid being caught in false breakouts and whipsaws.
The markets’ reaction to any type of data is unpredictable. This is not only the case when the news release is in line with analyst expectations, as published by news channels and financial news providers, but also when the release surprised significantly. Sometimes it’s not even possible to predict how volatile the markets reaction will be to the news release. Sometimes the market will move within a range of fifty or more pips in response to data released. Sometimes a 100-pip movements in the span of one or two minutes will be reversed and completely negated by the price action during the rest of the day. Conversely, while news releases are usually the most volatile periods of a typical trading day, a very unusual release may be welcomed with relative calm if the market decides to do so. What is the cause of all this great unpredictability?

During a news release a number of speculators will react immediately, hoping to gain a quick profit and exit. These will create a very brief ballooning of spreads and volume in the immediate term, but also will distort the underlying technical picture greatly. As these initial buyers or sellers exit, momentum traders will attempt to join in and fuel a more sustainable short-term trend with their actions. Depending on the time and liquidity in the market, they may well be successful, but sometimes they too are checked by previously unknown order layers that check the advance of the price. When these absorb the momentum traders, and short term speculative entrants, the initial reaction of the price may be reversed or negated also.
But while this is so, we do not imply that it is not possible to trade the news in the forex market. All that must be born in mind by the trader is that he’s engaging in a game of probability; he must be very well aware that there doesn’t exist a news release that will ensure that the market will move in this or that fashion. Stop loss orders must not be very tight, and leverage must be kept quite low, so that the order we enter can survive more than a few seconds of the initial shock reaction by short-term actors.
The two major problems of trading the news arise out of the difficulty in gaining timely information, and evaluating that in a fast enough manner to facilitate quick entry into a trade. Hence, it is clear that the trader must have a very good idea of what he expects from the news release. Will he only open a position if the data shock the market? What is the threshold value for the data, above or below which a trade is justified? How long will the position be held? Which technical levels constitute the take-profit, or stop-loss orders for the trade? All these must be discussed and determined even before a trade order is entered. News releases must not be periods when the trader will be hesitating and vacillating between the various paths he can take. Instead, he must act like a machine, with almost automated movements, so that he can be immune to the emotional pressures created by the irrational short-term behavior of the market.

The last issue with trading news releases is born of the unreliable nature of the first versions. In fact, studies have shown that the BLS (the Bureau of Labor Statistics), for instance, consistently underestimates job losses in a recession, and underestimates job gains at the beginning of the boom. Nor does the experienced trader have any trouble in acknowledging this fact: revisions which reverse the meaning and character of the initial release are not at all exceptional in the markets. The short-term trader is not much bothered by this fact, but it has great significance for decisions on the long-term positioning.
There are two ways of trading the news.
1.Long term: Several academic studies have established that the impact of some news announcements have their immediate impact spread over a period of weeks and months, instead of the single day in which the markets are thought to discount them. Non-farm payrolls, and to a greater extent, the interest rate decisions of the federal reserve are good examples for this kind of news flow. While the markets react violently and unpredictably in the short term, the mechanisms set up by low interest rates, and full employment (or conversely, high unemployment) have consequences that are relevant to many sectors of the economy, and trading them on a long term basis is certainly possible. The trader who uses this strategy will build up his positions slowly, and will attach greater value to low frequency releases (such as GDP reports), and will wait until the overall picture offers clarity, before he makes his trade decisions.
2.Short term: To trade news on a short term basis, the trader must have a clear criterion on what kind of news will justify a trade. Many news traders seek at least a 50 percent surprise in the data to consider the release tradeable. The novice trader, in turn, can use the initial period of his trading career for perfecting his money management skills. Trading the news on a short term basis can be easy and lucrative if the trader is disciplined enough to cut losses, and accumulate profits, but panic and mood swings, and undisciplined methodology will quickly erase all the gains through shocks and volatility.

These are the various types of indicators which have the potential to cause the greatest short term movements in the markets

Consumer Price Index (CPI)

While very important, the severity of market reaction to CPI releases partly depends on the health of the general economy. In a booming economy, a string of uncomfortably high CPI values will force the central bank to raise rates in order to subdue growth. In a contracting economy, a high CPI value may prevent the central bank from realizing counter-cyclical interest rate reductions. Since central bank rates are so important for determining the tone of economic activity in the long term, markets pay great attention to the value of this indicator. On the short term, of course, these considerations have no relationship to the motives of speculators, but they do present the justification for violent short term price spikes for momentum traders and short-term speculators, if the data surprises in either direction.

Fed decisions

Depending on the nature of the decision, and how surprised by it the market is, the price swings can be very large and the immediate reaction meaningless with respect to the long term direction of the trend. Fed decisions are one of the most anticipated events in the market, and their macroeconomic significance certainly justifies this attitude. The Fed meetings typically last for about two days, beginning on Monday and concluding on Tuesday. Then the decision is released to the public at around 9 pm New York time.
Fed rate decisions can cause large movements if the rate change is different from what was expected by market consensus. In the absence of such a surprise, traders will concentrate on the tone of the statement accompanying the interest rate decision. Depending on how dovish or hawkish the statement is, the markets will readjust their future interest rate expectations, and on that basis they will reprice currency pairs. The repricing period can be quite long, and it’s unwise to expect this process to be completed in the course of a few weeks.
European central banks and the US Federal Reserve usually release their rate decisions during the first week of each month. As most of the important data are released during this first week from around the world, traders are exceptionally nervous and excited, amplifying volume greatly, but also increasing volatility, as the large amount of short term speculative money opens and closes very short-term positions. In fact, some traders turn the typical movements of this period into a trading strategy.

Non-farm payrolls

Sometimes called the mother of all data, on a typical month the time of this release coincides with the most volatile market action. Non-farm payrolls measure the payroll change of the non-farming private and public sectors. Since economic cycles, consumption, and consequently interest rates all depend on the employment situation of the US economy, the non-farm payrolls release is the most closely watched of all indicators.
For the most part, most experienced traders will avoid trading the immediate aftermath of this release, due to the somewhat nutty price action that follows it. If you’ll forgive the expression. On the other hand, if the trader is satisfied that the data release strongly suggests price movement in a direction, he will use the short term fluctuations that occur as a trading opportunity by entering orders that contradict the market’s short term direction.
While this data is so crucial to a nation like the US with a large domestic economy that is less dependent on trade and commerce, its equivalent is not as important for nations like Japan where the dynamics of the domestic markets is closely correlated to the situation of the global economy
The non-farm payrolls data is typically released by the Bureau of Labor Statistics on the first Friday of each month.

Purchasing Managers' Index (PMI)

The PMI provide a very quick and accurate snapshot of the status of the various sectors of the economy. They do not create as much volatility as the other major releases (such as the non-farm payrolls data, or Fed decisions), but as a result they are also more tradable and safer as entry points. Needless to say, a very extreme value can create massive price shocks in either direction, but the real use of this data is for the guidance it provides for predicting the much more important data that is released towards the end of the week. We can trade these releases both on a trend following, or contrarian basis, depending on what our analysis is telling us about market positioning and the fundamental picture.

onclusion

There are many more releases, and the trader can study each of them for creating his own strategy. The key point is protecting ourselves from emotional extremes, and making sure that we only open positions when we are really satisfied with the data release, and are confident that the scenario offers a reasonable profit potential.


Trend Trading Time Frames

Several different possibilities exist for how to trade a freshly identified forex market trend. These strategies can vary significantly depending on the time frame that the directional trending movement in the exchange rate occurs within.
Essentially, once a trader has correctly identified the direction of the current trend - perhaps by drawing a trend line between successive highs or lows and observing whether it has a positive or negative slope - they will then be able to determine what period of time the trend covers.
They will also want to choose a trading strategy that is appropriate for that time frame to use to profit from the expected continuation of the trend.
The time frames for which positions are commonly held when trend trading usually consist of the following:
  • Short-term Trend Trading - This strategy identifies short term trends whereby the trader looks to profit from moves occurring within a holding period that can be from less than one day to more than a week.
  • Medium-term Trend Trading - In this strategy, the trader identifies the trend within a time frame that usually can last from a few weeks to a few months. For example, the long term trend can be higher, while the medium-term trend might be sideways, indicating to the trader to trade within a range.
  • Long-term Trend Trading - Makes up one of the most profitable trading strategies when executed accurately by a seasoned trader. The objective of this type of strategy is to identify the long term trend, wait for an opportunity to establish a position at an optimum price, and hold the position until the major trend reverses, which can be anywhere from several months to several years.

Trend Trading Strategies for Different Time Frames

The next consideration undertaken by the trader might involve determining what type of trading strategy will be used to profit from the trend.
The kind of trading strategy employed may also depend on what time frame is associated with the trend as follows:
  • Short Term Trends - A trader will often use a short term trend to take small profits out of the market. They will generally execute a higher volume of trades when trading short term trends.
  • Medium Term Trends - Once a medium term trend is identified, it is usually traded by picking an optimal price, usually near support or resistance levels, to initiate a trade in the direction of the trend. The trader then aims to take profits as the market trades toward the medium term trend line drawn through successive major highs for an up trend and through successive significant lows for a down trend.

    • Long Term Trends - Often the most profitable trading positions when traded effectively, a long term trader will typically wait for a pullback to initiate a position in the direction of an established long term trend. They will then hold a winning position until the end of the trend is reached and a clear sign of a reversal is detected.
    Basically, trading appropriately with the trend entails a trader also considering the time frame involved in the movement, since the best trading strategy may not be as simple as buying when the market is in an uptrend and selling in a downtrend.

Sunday, February 6, 2011

Forex trading strategy #1 (Fast moving averages crossover)

Trading systems based on fast moving averages are quite easy to follow. Let's take a look at this simple system.
Currency pairs: ANY
Time frame chart: 1 hour or 15 minute chart.
Indicators: 10 EMA, 25 EMA, 50 EMA. Entry rules: When 10 EMA goes through 25 EMA and continues through 50 EMA, BUY/SELL in the direction of 10 
EMA once it clearly makes it through 50 EMA. (Just wait for the current price bar to close on the opposite site of 50 EMA. This waiting helps to avoid false signals). 
Exit rules: option1: exit when 10 EMA crosses 25 EMA again.
option2: exit when 10 EMA returns and touches 50 EMA (again it is suggested to wait until the current price bar 
after so called “touch” has been closed on the opposite side of 50 EMA).

FOREX TRADING SYSTEM
Advantages: it is easy to use, and it gives very good results when the market is trending, during big price
break-outs and big price moves. Disadvantages: Fast moving average indicator is a follow-up indicator or it is also called a lagging indicator, which means it does not predict future market directions, but rather reflects current situation on the market. This  
characteristic makes it vulnerable: firstly, because it can change its signals any time, secondly – because need to watch it all the time; and finally, when market trades sideways (no trend) with very little fluctuation in price it can
give many false signals, so it is not suggested to use it during such periods.

Forex trading strategy #2 (Slow moving averages crossover)

Current strategy applies the same principles as Strategy #1.
Use time frame and currency which respond the best (1 hour, 1 day… or any other).
Indicators: (multiple of 7) 7 SM
Entry rules: When 7 SMA goes through 14 and continues through 21, BUY/SELL in the direction of 7 SMA once price gets through 21 SMA.
Exit rules: exit when 7 SMA goes back and touches 21 SMA.
A, 14 SMA, 21 SMA
FOREX TRADING SYSTEM
Advantages: again it is an easy set up and does not require any calculations or other studies. Can produce very good results during strong market moves, the system also can be easily programmed and traded
automatically. Disadvantages: System requires periodical monitoring according to a chosen time frame. SMA indicator signal can be confirmed after the current price bar has been fully formed and closed. In other words, when S MA stops changing and the signal is fixed, traders may rely on such information to open a trade.
.

Forex trading strategy #2-a (28-100 MA trading)

ndicators: 100Ema applied to close and 28 smooth moving average applied to close.
Time frame: 1hr and 4hr
Currency: Any, but i guess Eur/usd would be preferable.
Entry: the 100ema shows the trend. So if we were in a down trend as given by the 100ema and a candle closes above the 100ema, we enter a buy, you would stay in that buy until a candle closes below the 28 and re-entries
are made using the 28 once price touches it or closes above it when it has first closed below it. The reverse is for a sell trade
For 1hr, stop loss should be 50-60pips while take profit should be 70-120pips, for 4hr stop loss should be 100pips while take profit should be 100-500pips.
I hope this makes for you good pips,suggestions and questions are welcome
.

Forex trading strategy #3 (Stochastic High-Low)

Forex systems which adopt a Stochastic indicator for monitoring the price provide some very good tips about the situation on the market for traders that are willing to see it.
Currency pair: Any.
Time frame: Any.
Indicator: Full Stochastic (14, 3, 3)
Entry rules: When Stochastic has crossed below 20, reached 10, and then crossed back up through 20 – set BUY order.
Entry rules: Sell when Stochastic has crossed above 80, reached 90, and then crossed back down through 80.
 Exit rules: close trade when Stochastic lines rich the opposite side (80 for Buy order, 20 for Sell order).
FOREX TRADING SYSTEM

Advantages: gives quite accurate entry/exit signals in well trending market.
Disadvantages: needs periodical monitoring. Stochastic is suggested to be used along with other indicators to eliminated entering on false signals.


Forex trading strategy #4 (RSI High-Low)

Although no trading system can solely rely on RSI indicator, using it in combination with other tools and proper technical analysis can bring a new edge to your Forex trading.
Setup:
Currency pair: Any.
Time frame: Any.
Indicator: RSI (14) with levels at 70 and 30.
Entry rules: Buy when RSI has crossed below 30, formed a bottom, and then crossed back up through 30.
Entry rules: Sell when RSI has crossed above 70, formed a peak, and then crossed back down through 70.
Exit rules: not set.
FOREX TRADING SYSTEM

Advantages: RSI is a very good indicator to refer for confirmation for any entry in any simple or complex trading system. For current trading method it advices well on entries, but opportunities occur not that often.
Disadvantages: monitoring is needed, still false signals take place. Strategy is suggested to be used in combination with other ones.


Forex trading strategy #5 (Stochastic lines crossover)

Here is a very basic overview of a role of a Stochastic indicator in the Forex trading. Knowing exactly what to expect from Stochastic, if you ever plan to add it to your own system, will affect trading results dramatically. For this trading method:
Currency pair: Any.
Time frame: Any.
Indicator: Stochastic (14, 3, 3)
Entry rules: Buy when the faster moving Stochastic line crosses above and up over slower moving stochastic line.
Exit rules: Sell when the opposite situation (next crossover) occurs and right after that open an opposite position.
 It is again recommended, once the first touch of Stochastic lines (possible future crossover) has been spotted, to wait until the following price bar on the chart has closed and only then take actions.
FOREX TRADING SYSTEM
Advantages: can give entry and exit rules, easy to use. Disadvantages: Stochastic is a lagging indicator – with this lines crossover system it can create a lot of false signals. Traders may want to change Stochastic regular settings for each particular currency pair to eliminate as 
many false signals as possible. Stochastic crossover system is good when used in combination with other indicators.


Forex trading strategy #6 (Double Stochastic)

By doubling on Stochastic analysis we are doubling on trading accuracy... However, one should remember that with each new Forex tool added complexity can appear; and a very complex approach is not always good.
Strategy Requirements:
Currency pairs: ANY
Time frame chart: 1 hour, 1 dayIndicators: Full Stochastic (21, 9, 9) and Full Stochastic (9, 3, 3). Entry rules: When the Stochastic (21, 9, 9) lines’ crossover appears – enter (or wait for the current price bar to close and then enter). It will be the major trend.
ook at Stochastic (9, 3, 3) to anticipate swings inside the main trend and re-enter+ the market again – additional entries. Also ignore the short-term moves Stochastic (9, 3, 3) that signal for exit – do not exit early until Stochastic (21, 9, 9) gives a clear signal to do so.
Exit rules: at the next cross of major Stochastic (21, 9, 9) lines.


FOREX TRADING SYSTEM

Advantages: using two Stochastic indicators helps to see the major trend and the swings inside it. This gives more accurate entry ruless and gives a good exit rules.
Disadvantages: needs constant monitoring, and again we are dealing with a lagging indicator.

Forex trading strategy #7 (Simple MACD crossover)

Trading with MACD indicator is widely used by Forex traders.
Let's take a glance at the very basis of currencies trading with MACD indicator.
We will need only MACD indicator with standard settings: 12, 26, 9.
Any time frame as well as any currency pair can be used.
Entry rules: When the MACD lines’ crossover appears – enter (or wait for the price bar to close and then enter).
Exit rules: when MACD lines next crossover occurs.
 
FOREX TRADING SYSTEM

Advantages: very simple approach and can give good profitable entries. Traders may want to change MACD default settings depending on the currency and chosen time frame. For example, traders may test next MACD set ups:
USD/CHF MACD (04, 07, 16), EUR/USD MACD (02, 03, 20), GBP/USD MACD (02, 03, 04) for different time frames. Disadvantages: you will need to sit and monitor it again and again. MACD has little use in sideways trading market. 
It is also never used alone, but rather in combination with other indicators. To your trading success!

Forex trading strategy #7-a (The "stupid guy" system)

Today I want to share my "Stupid Guy" Trading System that can make pips up to 50-100 pip a day! ^_^
Lets go!
Pair = EUR/USD only
Time Frame : 15 Minute Only
Zoom out to 50 or 75 percent to see the magic.
nd the secret is... MACD!
Set it to 35 45 30.
The Rule is, ENTRY WHEN CROSSING. ITS so simple!! Check the picture below!


Patient is the key, and you may sometimes checkout the Histogram Divergence to spot next cross. Don't forget to set trailing stop (SL+), Avoid News, Cut Loss when MACD cross again (almost never happen)
Happy Stupid Trading ^_^ See you at the top!

Forex trading strategy #8 (EMA breakthrough)

Sooner or later all Forex traders begin experimenting with different EMA settings.
Quite often very interesting combination can be spotted. Here is one Simple Forex system based on 50 EMA indicator
Any currency pair.
Time frame: 90 minute or 3 hour chart
Indicator: 50 EMA.
Entry: watch for a candle to pierce 50 EMA and finally close above (to enter Long) or below (to go Short). Enter with the second candle after it makes 5 pips higher than the previous one.
Exit: not set.
Stop loss order: 15 pips below 50 EMA.
FOREX TRADING SYSTEM

Forex trading strategy #8-a (My Line In The Sand)

Every one says keep it simple and the trend is your friend. This is as simple as it comes and it utilizes daily trends in the Forex.
Currency pairs: ANY
Time frame chart: Daily
Indicator: SMA (I use a 30 SMA on most my charts but the idea is to choose a SMA that gives you the best looking trends.)
Entry / Exit rules:
Crossing the SMA in either direction, in other words you reverse your position when ever the price crosses the SMA
 Money Management:
2% of your account per trade
1 open trade per pair with a stoploss of 1/2 % of your account (even though the idea is to reverse your trade every time the price crosses the SMA, there will be times that you’re not going to be there in front of your computer
and in those cases you will need a stoploss to ensure your account only takes a small loss
Advantages: This is a trend following system and the Forex does trend.
Disadvantages: In periods when the market is not trending there will be a lot of little losses. (For me, this is price I pay in order to catch a big trend.)

Forex trading strategy #9 (Trend line tunnel)

Creating a support/resistance tunnel on the price congestion and trading on the break of this tunnel is a milestone of Forex trading discoveries
his trading system/approach needs no indicators and can be applied to any currency and traded in any time frame where coiling in a tight range is spotted.
Entry rules Find consolidation on the chart and draw two horizontal trend lines – support and resistance. Once the price breaks trough one of the trend lines and a current price bar closes outside the tunnel – buy/sell in the direction of the breakout
(If price pierces the trend line, but did not close outside the tunnel, cancel the previous trend line and draw another one according to the new conditions).
Note: also very often happens that once the price makes it through support or resistance it rocks down/up very quickly and so, more aggressive entry can also be adopted – without waiting for the current price bar to close.
Exit rules: not set, however, it is believed, that the price after breaking the tunnel will travel the distance equal to the width of that tunnel.
FOREX TRADING SYSTEM

Advantages: very simple and extremely effective. It can provide 100% profitable entries if short profits are taken - usually with the close of the first candle right after the entry.
Disadvantages: very accurate and well thought entry point should be picked. Orders placed very close to the tunnel can be triggered by sudden whipsaw early before real breakthrough occur..:
.

Forex trading strategy #10 (H4 Bollinger Band Strategy)

H4 Bollinger Band Strategy
Tools : Bollinger Bands(20)
TimeFrame : H4
Currency : ALL
This strategy is extremely simple and I use it to detect opportunities and it is very good.
If you open an H4 EUR/JPY chart and you insert the Bollinger Bands(20) indicator, if you observe the chart you will see that the bands are simply a Resistance and Support. The Upper band is a Resistance and the Lower Band is aSupport. If you pay attention to the chart you will see that most of time the price hit the upper band then it retraces back to Lower Band, so how I trade is very easy, I wait till the price touches let’s say the upper band and
closes under it (not above it) and wait till the candle is formed, when it finishes and the next candle opens under the previous Upper band then I enter a Short trade with target = 100 pips or until it touches the Lower Band.
Same thing when it touches the Lower band and the candle closes above it, and the next candle opens above the previous Lower Band then I go Long with Target = Upper band or 100 pips. You can develop this strategy as I did, and you can profit a lot, I made more than 800 pips this month.
You can check my website for any further help http://rpchost.com . If you think in this technique and observe the chart I am sure you will develop this strategy quickly and make 99% winning trades.
Good Luck.
H4 Bollinger Band Strategy (Part II)
Tools : Bollinger Band(20)
TimeFrame : H4
Currency : ANY
This strategy is a continuation of the previous strategy I submitted before (Forex trading strategy #22 ).
This strategy is very simple, and you can find more details at Rpchost.com forex forum.
First open a currency (per example EUR/USD) and H4 timeframe, issue suitable breaklines from the bollinger band (visual examples are at rpchost.com forex forum), now wait till a candle breaks the breakLine. This break is not a
trade signal we must have an extra confirmation, here come the role of the bollinger band. look at the bollinger band upper and lower, if they are both opened which means upper band is UP and lower band
is DOWN, then it is a confimation of a trade.
Good Luck.


Forex trading strategy #11 (GBP/USD breakouts)

GBP/USD
when it is 1 hour to london open, draw lines on the highest high since midnite and lowest low since midnite, just trade the breakout and let ur stop loss be at the high of the candle that broke the low line for short trade and the low of the candle that broke the upper line for long trade
if u experience a breakout before New York Open, please target the first 30pips
if beyond New York Open before a break please target between 10 to 20 pips
Happy Trading!!!

Forex trading strategy #12 (3 white soldiers / 3 black crows)

Very Simple system - simply look for 1 of 2 candle formations at or near the bollinger band (in this case the default 20)
You are looking for either 3 consecutive bulish candles for a buy, 3 consecutive bearish candles for a sell - that's it!!! - 3 white soldiers / 3 black crows formations
three white soldiers Forex

three white soldiers Forex
Things to note. On the larger moves, the price WILL retrace. Best thing to do in this situation is when you see this happen (typically 1 or 2 candles in the opposing direction) simply close the trade and re-enter when the price has returned to the point where the change started. as for exit strategy - a lot of the time you can count on approx 2 - 3 times the value of the retracement (e.g. if the price retraces 10 pips, then you are looking on the re-entered trade of a TP between 20 - 30 pips!
You can use ANY 3 consecutive candles, however this works best when the price has just "bounced" off the Bollinger Bands.

Forex trading strategy #13 (The Fractal Guru Strategy)

Time Frame : 15mins and above
Indicators : Average Directional Movement Index - ADX (Settings : 14) and Fractals


Fractal ADX strategy Forex

Background on Fractals and ADX?
ADX Indicator or Average Directional Movement Index gives you a reading of how strong the market is trending. We will use this to our favor and combine it with Fractal Indicator to pick a high probability trade. These indicators can be found by default in your indicators list on your Metatrader 4 platform. Fractals show peaks and dips. To explain it easier, a Up Arrow Fractal forms when there is a lower high on both sides of a candle. A Down Arrow Fractal orms when there are higher lows on both sides of the candle. Please note that fractals will only form when the candle closes with the given criteria of high lows or lower highs on both sides.
Understanding The Fractal Guru Strategy
When the ADX is trending by seeing the blue line rising steadily, we look for Fractals to jump in the trend. We do not take all Fractals, only the ones with tails pointing to the Fractal. Let me explain this in a bit more detail and as simple as possible with some examples. (I will also be posting a video tutorial with this to help understand this method.)

Long (Buy) Positions Using The Fractal Guru Strategy
- On the ADX, the dotted green should be above dotted red and the solid blue line should be steadily rising
- Look for a Candlestick with a tail pointing to a Down Arrow Fractal
- When you see this Down Arrow Fractal, enter Long.
- Place stops 5 pips below the low of the Fractal Candle.
- Exit using proper money management or upon the cross of the dotted green and red lines in the ADX.
Long Position Example 1 :
http://www.urbanforex.com/images/forex_strategies/fractal_guru/fractal_g...
Long Position Example 2 :
http://www.urbanforex.com/images/forex_strategies/fractal_guru/fractal_g...
Short (Sell) Positions Using The Fractal Guru Strategy
- On the ADX, the dotted red line should be above dotted green line and the solid blue line should be steadily rising
- Look for a Candlestick with a tail pointing to a Up Arrow Fractal
- When you see this Up Arrow Fractal, enter Short.
- Place stops 5 pips above the high of the Fractal Candle.
- Exit using proper money management or upon the cross of the dotted green and red lines in the ADX.
Short Position Example :
http://www.urbanforex.com/images/forex_strategies/fractal_guru/fractal_g...


Forex trading strategy #14 (ADX Power)

ADX POWER
- Timeframe: I use it on 4 hours, feel free to use it on smaller timeframes as well
- Currency Pair: Any
- Indicators: EMA9 and EMA26 and DMI (Directional Movement Indicator with ADX)
- DMI Settings: Draw a horizental line at 25 to watch for the crossovers of DI+ or DI-
- ADX Settings: Ignore signals where ADX is lower 20
GO
LONG WHEN:
- EMA9 has crossed over EMA26
- DI+ >= 25
- ADX >= 20
- ADX is in between DI+ and DI-
EXIT LONG WHEN:
- EMA26 has crossed EMA9 AND
- DI- is higher than D

GO SHORT WHEN:
- EMA26 has crossed EMA9
- DI- >= 25
- ADX >= 20
- ADX is in between DI- and DI+
EXIT SHORT WHEN:
- EMA9 has crossed EMA26 AND
- DI+ is higher than DI-

WHAT TO IGNORE:
- While in Long Position: DI+ and DI- Cross-overs while the EMA9 is still on top of EMA26
- While in Short Position: DI+ and DI- Cross-overs while the EMA26 is still on top of EMA9
- While searching for Trading Opportunities: The EMAs has crossed over but the DI+ or DI- (depending on whether you're looking for Long or Short positions) are still under 25. Also, wait till the ADX has reached 20 before entering into Trade
- Price breaking the Lower EMA (EMA26 in case of Long Positions) line while the EMA9 is still on top of EMA26

Forex trading strategy #15 (Trend line simple trading)

I have been working on a very simple trend following system. It requires no indicators..... only a trend line. Some functions are going to be automated to address my weak points. I am in the process of getting someone to write it now.
Basic strategy:
Trendline placed and named (something simple BBB for buy SSS for sell)Necessary to identify what should be followed.
trade opened automatically in direction of trendline once price has moved 5 points above trend line in a BUY or 5 points below line if a SELL. This provides a degree of safety should the trend not go as planned.
Stop loss automatically set at 5 points below entry for a BUY, and 5 points above for a SELL. Again, a safety point.
Trade will stay active until trendline is broken by X number of points (configurable) or if the stop loss is triggered.
Trailing stops not needed. It's already handled in the functions.
An audible alert when trade is closed.
Can be used for times you can stay and play or longer trends when you cannot.


Trend line simple trading


Forex trading strategy #16 (Picking tops and bottoms on Bollinger Bands)

Picking tops and bottoms on Bollinger Bands
By using multiple time frames and candle stick formation we will uncover how to pick tops and bottoms while trading in the trend of the bigger time frame.
We begin by looking at the daily chart to ascertain what direction we looking to trade by using the common Bollinger Band indicators middle line. A pair trading above the 20SMA is in short term up trend. A pair trading below the 20SMA is in a short term down trend.
Once we find our direction we move to the smaller time, 4hour and 1hour, there we look for weakness in a uptrend (touch of bottom bands) and strength in a down trend (top of bands).


 http://forex-strategies-revealed.com/files/pictures_strategies/bb_gy.png

Saturday, February 5, 2011

Barcelona vs Atletico Madrid 3-0 - All Goals & Full Match Highlights - 5...


Barcelona vs Atletico Madrid 3-0 - All Goals & Full Match Highlights - 5...

Starting Out Trading Forex

Starting Out Trading Forex


Public interest has steadily grown in the forex market since the relatively recent advent of online forex trading for retail clients. Most online forex brokers offer their proprietary trading software free of charge to their clients, as do some independent trading platform developers.
As a result, getting started trading forex can now be as easy as getting access to a trading platform from your computer and funding an online forex trading account with a retail forex broker

Get Educated About Forex Trading

Nevertheless, learning how to trade forex profitably usually takes some time to accumulate the experience necessary to make the most out of trading the huge currency market.
This process can be sped up considerably by getting a good basic education in how the forex market operates, technical and fundamental analysis, money management and how to make money trading forex.

Accumulate Sufficient Funds to Trade With

Of course, all of your forex trading education will be pointless if you do not have access to some liquid funds that you can put at risk without fear of hurting your self or your family by not being able to meet essential obligations. In other words, do not plan on betting your house or your rent payments in the forex market.
You will need to accumulate sufficient funds to place on deposit with your chosen retail forex broker to allow you to take the sort of positions that will be worth your time involved in analyzing, initiating and watching them.
This money will be used as collateral against possible losses you might incur when trading forex on margin. Although you can often open an account with less than $100, be aware that this will probably not be enough to be meaningful when trading forex, although it may be useful for practicing trading.
Also, you will probably want to have enough funding in your account to avoid margin calls or automatic closeouts of trading positions by your broker prior to your preferred stop loss level.

Come up With a Trading Plan

Just about every consistently profitable forex trader uses a trade plan and follows it in a disciplined way. Accordingly, this successful trading mindset represents a key forex trading guide post that you will want to emulate as you learn to trade forex.
Many such traders use relatively simple technical analysis techniques that they incorporate into their trading plan. Perhaps they might observe classic chart patterns in the process of forming, or they might look for trading signals on various technical indicators.
The main characteristic that you will want to achieve with your trade plan will be an objective way to trade the forex market that will help you remove the emotional element from your trading activities.

Learn How to Manage Your Risk

This simple math shows how digging your way out of a hole in terms of your trading portfolio can be both difficult and ultimately unrewarding. As a result, it is usually far better to avoid getting into that hole in the first place, and managing your risk wisely can help you do this.
Even if you have already taken the time to develop a trading plan, if you have not included a sound trading risk management component in your plan this will usually expose your account to considerable potential losses that can be readily avoided.
Risk management usually involves the process of identifying trading and business risks and putting suitable safeguards in place to prevent them from putting you out of business.
When trading forex, this usually means having a stop loss order level on each position, and then trailing those stops to protect accumulated profits in case of a market reversal.


Powerful FX Strategy: Range Expansion Reversal Strategy Part 1

Powerful FX Strategy: Range Expansion Reversal Strategy Part 1


Have you ever thought about the daily range of a currency pair? If you have been trading for some time, you know that currency pairs tend to reach the extent of their daily range at some point in the New York session.  The truth is that with a bit of technical analysis, a trader can oftentimes determine the general area where a currency pair will be exhausting its daily move, reversing, and trading back into its daily range.  This simple, but powerful trading scenario is the backbone of the range expansion reversal strategy.  In this article, we will break down the specifics of this trading strategy, and with a little personal tweaking, it could become a valuable part of your overall trading approach.

First let's break down the idea behind the strategy a bit.  The Range Expansion Reversal Strategy is essentially a reversion to mean strategy.  Reversion to mean is a statistical term that refers to the following mathematical law:  over time, data will tend to return to the mean, or average, of the entire data set.  Therefore, in this strategy that means that as a currency pair exhausts its daily range each day, it tends to reverse at some point and return back into the average daily range; thus, this strategy is called range expansion reversal strategy-as a currency pair exhausts its average daily range, we are looking to fade the daily momentum in anticipation that the currency pair will return back into its daily range.

Average Daily Range

Currency pairs do not move an infinite amount of pips per day.  In fact, under normal market conditions, a currency pair generally moves within a relatively predictable range known as the Average Daily Range.  Average Daily Range is calculated as follows:

Determine the Daily Range of A Currency Pair over X number of days

This can be done be done manually, but the best is to use an ADR indicator.  Your forex platform should have that available.  You should be able to see the ADR over any number of days you choose.  It is best to look at the ADR over the last 5, 10, and 20 days.  If the numbers are all similar, say 120 pips plus or minus a few pips, then that gives you a good idea that the currency pair is generally moving about 120 pips in current market conditions.  Now that you understand how to find the average daily range, let's break down how to use this information to formulate an actual trading approach for the forex market.

Once you determine the average daily range for a currency pair, then you simply look from the day's open at midnight and determine where that price area is on the chart.  For example, let's use the EUR/USD and assume that the EUR/USD opens the day at 12:00 am est at a price of 1.2200.  You want to let price make its move between 12:00 am and 5:00 am.  During this time, the market will begin to form the HI and LO of the day.  Take a look at this chart:
 
You can see the day opened at midnight est at 1.2880.  Then as London opened up, price fell to a low of 1.2788 before price moved back up to 1.2811 just prior to the NY Open.  Now, during the NY session, you know where price may find support if it keeps moving to the downside or resistance if it moves strongly to the upside.  Assuming the ADR is 120 pips, then the euro should find support somewhere around the 1.2760 area.  This number is calculated by taking the HI of the day (1.2880) and subtracting 120 pips (ADR).  Conversely, if the low at 1.2788 holds and the euro finds lots of buying strength during the NY session and pushes higher, then it should find resistance in the 1.2910 area.  This number is calculated by taking the LO of the day (1.2788) and adding 120 pips (ADR).  You now have a general idea of where price is going to find either support or resistance during the NY trading session.

The Next Step

Once you pinpoint these potential areas of support and resistance, you want to back out to the higher timeframes (1 Hour and 4 Hour) to see if there is any substantial support/resistance in these price areas that may offer further support for your trading idea.  Any number of technical tools can be used, but horizontal support/resistance, Fibonnaci retracements/extensions, and pivot points are a few of the best.
 
The chart above is a 4 Hour Chart.  You can see that the resistance level of 1.2910 has quite a bit of resistance.  First of all it is the previous swing HI on the 4 Hour Chart, and to the left you can see that this area has acted as strong support for several days.  The green shaded boxes show several failed attempts for price to move above this price area.

To the downside you can see that the 1.2760 area we calculated is the 50% fib of the last swing on the 4 Hour Chart, which is quite significant.  Also, you can see the green shaded box on the 50% fib level where this 1.2760 area was a strong level of resistance.  Now that price has broken through this level, it should act as support if the euro does continue to move down during the NY trading session.  You can also see further to the left in the green shaded box that the 1.2760 area has acted as support for price before.

Now, you have a trading plan.  You have confirmed support in the 1.2760 area and you have confirmed resistance in the 1.2910 area.  As price begins to move to one of these two areas during the NY trading session you are going to be poised and ready to engage the market and fade the daily momentum back into the currency pair's average daily range.

Now, you should have a solid, basic understanding of the principles behind this strategy.  In Part 2 of the Range Expansion Reversal Strategy, we will discuss each of the following:

  • Entries
  • Profit Targets
  • Stop Loss
  • How To Avoid Potential Losing Trades Using A Few Proprietary Tools
  • And more...


Cross Rates and Cross Currency Pairs

Cross Rates and Cross Currency Pairs


The forex market's most actively traded currency pairs all include the U.S. Dollar, and those pairs tend to be where the greatest liquidity exists in the forex market.
Nevertheless, many other currency pairs which do not involve the U.S. Dollar offer ample trading opportunities. These are usually referred to as the cross currency pairs or just the crosses, and their quotes are called cross rates.
The most actively traded crosses or cross currency pairs in the forex market are further divided into the Major Crosses and the Minor Crosses.
The Major Crosses
The currency pairs referred to as the Major Crosses consist of the most actively traded currency pairs which exclude the U.S. Dollar.
Most of these currency pairs have dedicated Interbank market makers and brokers and include the following currency pairs listed in alphabetical order:
  • EUR/CHF
  • EUR /GBP
  • EUR/JPY
  • GBP/JPY
The Minor Crosses
The Minor Crosses, as the name implies, make up the less active cross currency pairs that generally do not have dedicated Interbank market makers or brokers.
Nevertheless, the Minor Crosses remain popular among forex traders and offer significant trading opportunities since they can show prolonged trends.
The currency pairs which make up the Minor Crosses include the following:
  • AUD/CHF
  • AUD/JPY
  • CAD/CHF
  • CAD/JPY
  • CHF/JPY
  • EUR/AUD
  • EUR/CAD
  • EUR/NZD
  • GBP/AUD
  • GBP/CAD
  • GBP/CHF
  • GBP/NZD
  • NZD/CHF
  • NZD/JPY
How to Compute Cross Rates
When a retail forex trader decides to take a cross position in EURAUD using U.S. Dollar quoted rates, they may need to compute the correct cross rate bid and offer prices.
Consider the following major exchange rates that are quoted as follows:
EURUSD = 1.2500/05
AUDUSD = 0.9000/05
To compute EURAUD, you can first separate the quotes for greater clarity:
AUDUSD: Bid: 0.9000 Ask: 0.9005
EURUSD: Bid: 1.2500 Ask: 1.2505
The overall objective here is to determine how many Australian Dollars it will take to buy one Euro in order to determine the EURAUD cross rate
To obtain the bid rate for the cross to start with, you will want to sell Euros on the bid side of the quote at 1.2500 while you will at the same time be buying Australian Dollars on the offer side at 0.9005. These will both be done in equal amounts of U.S. Dollars, so both spreads will be crossed as a result.
Therefore, you will obtain a bid rate for the cross of:
(1.2500 EURUSD) / (0.9005 AUDUSD) = 1.3881 bid for EURAUD
Conversely, on the offer side of the quote, the transaction will involve buying Euros at 1.2505 and selling the Australian Dollar at 0.9000, also in equal amounts of U.S. Dollars and crossing both spreads.
This yields an offer rate for the EURAUD cross as follows:
(1.2505 EURUSD) / (0.9000 AUDUSD) = 1.3894 offer for EURAUD
The results of the calculation would give a two way market for EURAUD of 1.3881 to 1.3894.
You will note the rather wide dealing spread of 13 pips that includes both the spread for EURUSD and the spread for AUDUSD. This spread will sometimes be narrowed if you can deal the more actively traded crosses directly rather than through their component currencies quoted versus the U.S. Dollar.


Trading Market Classifications

Trading Market Classifications

Trading markets generally tend to fall into one of the two primary categories of trending and non-trending markets.
Furthermore, markets also demonstrate a number of more specific trading pattern types. These classifications will be described further in the following section.
Trading Market Types
The following list includes the more common trading patterns commonly used by forex traders, technical analysts and market commentators to identify various market types or classifications. Also included in the descriptions for each type are the classic chart patterns that tend to arise in such markets.
  • Trending - markets showing extended price movements in one overall direction, with occasional corrections or pauses. Trend lines can be drawn through a series of successive highs or lows to help define the general direction and slope of the trend.
  • Up trends - markets characterized by higher highs and higher lows. Up trends can form upward slanted channel patterns when their upper and lower trend lines are parallel to each other.
  • Down trends - markets characterized by lower highs and lower lows. Down trends can form downward slanted channel patterns when their upper and lower trend lines are parallel to one another.
  • Trend-less - markets showing erratic price changes that do not last long before reversing, resulting in little overall directional price movement seen over time.
  • Choppy - markets showing an erratic broadening pattern with a series of higher highs and a series of lower lows. Choppy markets show an increase in volatility and may form expanding triangle patterns.
  • Sideways - markets showing a narrow trading pattern without making new highs or new lows and that does not reverse significantly. Sideways markets can form rectangle patterns. Also, when occurring after a significant move up or down they may form a flag pattern.
  • Consolidative - a market that is gradually decreasing its trading range with a series of lower highs and higher lows. Consolidative markets usually form triangle chart patterns, although when occurring after a sharp move up order down, they may form pennant chart patterns instead.
  • Ranging - markets trading in a range defined by a set of similar highs and a set of similar lows, often at important resistance and support levels. Ranging markets may form rectangle chart patterns, or after a sharp move they can form flag patterns.
Why Traders Classify Markets
These markets types are useful to identify, not just for market commentators attempting to describe succinctly what the forex market is doing, but also for forex traders since trending markets provide good profit opportunities for those traders that follow them.
Conversely, non-trending market types often allow traders to buy low and sell high, with stops placed outside extreme points.
Accordingly, technical traders will often peruse their forex charts carefully for signs that a trend they were following might be in the process of reversing or if the market is then entering a non trending period.
Following this market classification process allows them to adjust their trading strategies appropriately for the type of market currently prevailing.


Trading Strategy 101 - Cut Losses Short, Let Profits Run On

Trading Strategy 101 - Cut Losses Short, Let Profits Run On


Perhaps one of the most time honored and popular sayings among forex traders has a number of variations along the lines of the following words of wisdom:
"Cut your losses short, but let your profits run on."
This forex trading maxim has roots going back over a hundred and fifty years and pertains to trading in just about any financial market.
The basic idea behind the saying is to encourage traders to get out of losing trades quickly but to cultivate the patience to stay in their winning trades in order to let trading profits accumulate over time.
Remembering these wise words has kept many a novice trader from blowing out their trading accounts before they had time to become successful.

Cut Your Losses Short:  Manage Your Risk Wisely

Maybe no one ever goes broke taking a profit, as another well-known Wall Street trader saying implies. Nevertheless, a large number of former forex traders have managed to completely wipe out their trading accounts because they did not have the discipline to take what would initially have been a small loss quickly.
Managing risk responsibly by keeping losses small makes up one of the most important money management activities in a trading strategy, and most successful forex traders learn to employ this concept strictly in their trading activities.
In most cases, successful traders will manage their risk when trading forex by entering a stop loss order immediately upon taking a position. This allows the trader to control their risk to a certain degree on each trade they take.
Exchange rates can behave extremely erratically at times, especially after monetary policy shifts, major news announcements or central bank intervention. As a result, being prepared for the worst that can happen can ultimately save a forex trader both money and frustration in the long run.

Let Your Profits Run On: Allow Profits to Accumulate

While managing risk is very important, you will make an unlikely candidate for a successful forex trader if you do not allow your winning trades to run their course and earn you the big money that the forex market sometimes offers.
The key to doing this is to remember that once you have a winning position, you then need to cultivate the patience to allow for the position to mature into a sizeable gain, without giving into the temptation to rush in to take your profits too quickly.
Also, a useful strategy that successful forex traders use to protect their accumulated profits involves using a trailing stop loss order that will get you out of the trade once the market has reversed substantially.
Trailing stops makes up one of the primary techniques used by successful forex traders allow their profits to accumulate over time. Using them also has the distinct advantage of helping prevent winning trades from turning into losers, which forms the basis of yet another popular Wall Street trading maxim.


How to Trade Forex Using Trends

How to Trade Forex Using Trends


Trends simply help us anticipate market activity. This allows us to get into a trade early and ride the upward trend until the peak. It also prevents us from staying in a position too long and end up losing some gains. By using trend lines we're determining the peak so that we can get out at the highest point or the valley so that we can buy in at the lowest point. In short, we use trend lines to attempt to buy low and sell high. Of course, if you follow a downward trend, you simply do the converse.
In general terms, there are three trends we're going to look at. Whether it is the forex market or the stock market, prices basically move down, up, or sideways. Specifically we'll be talking about the end of each trend because that is when trading activity needs to take place. We will look at downward trends first because they are going to help identify the best place to enter a position. In discussing how to use trends to trade forex, you want to enter the position right after a downward trend has turned back up. The expectation is that we buy at a very low point and ride the new upward trend to its peak.
During a typical downward price fall, you will find all of the peaks going lower than the points right before them. At the bottom of this run, you'll find one peak rising above the previous one. This represents a potential swing back to an upward price trend, and that is your buy point.
Once you've made your purchase, now it is time to ride the new upward trend to the top. The first question that should come to mind is, "How do we know when we're there?" Since you don't want to stay in a position too long and give back some of your price gains, you need to be able to identify where the trend stops. An upward price trend will have peaks that are higher from one point to the next. The top is going to be the point where one price peak drops below the one before it. If you identify the downward turn correctly, you'll sell your position and retain the gains you experienced as the price climbed. The process is then repeated as you ride out the downturn trend until it hits the bottom.
The last trend we need to discuss is the sideway trend. This is essentially an interlude between up and down trends-a calm spot in the market. What do you do when there is no definitely upward trend or downward trend? While you will have peaks and valleys in a sideway trend, you will not have large gains available. Whether or not you trade during this trend is something to be decided based on how large of a profit potential is present in the peaks and valleys. Typically, it's probably not worth the risk to trade in a sideway trend. Basically, you'll use these trends as a potential early warning to a shift from the previous trend.


The Carry Trade and Its Risks

The Carry Trade and Its Risks


When considering taking on a carry trade position, a forex trader will first want to take into account the interest rate differential and their forecast for the currency pair over the desired time frame for the carry trade.
If both of these elements look favorable for the trade, then the next factor they might want to consider will be the effect of compound interest on their trade.
The following sections will focus on the carry trade and how compound interest affects its success.

What is the Carry Trade?

The so-called carry trade has become quite popular with hedge funds and other large currency speculators. The transaction is often done in quite large amounts to produce attractive returns for these traders, although it may not be worthwhile for retail currency traders dealing in smaller sizes.
In general, the carry trade involves going long a currency with a high interest rate and short a currency with a low interest rate. The position will then be held for an extended time frame to take advantage of this interest rate differential.
A typical forex carry trader will also generally seek to identify a currency pair that they forecast to have an exchange rate movement during the carry trade period that favors the higher interest rate currency.
Popular carry trade currency pairs involving major currencies include: AUD/JPY, NZD/JPY, AUD/USD and EUR/JPY.

Carry Trade Risks

While carry trades might seem an attractive way of profiting from your forex trading activities and wide interest rate differentials between currencies, be aware that these trades also have a substantial potential for loss, as well as profit.
The following list includes some of the primary risks commonly associated with carry trades.
  • Currency Risk
Since carry trades will generally be held unhedged, this means that any return from the interest rate differential needs to be in excess of any adverse exchange rate movements in the carry trade currency pair.
As a result, a currency pair will usually be chosen for the carry trade for which the trader forecasts the higher interest rate currency will appreciate over the chosen time frame relative to the lower interest rate currency.
The carry trader might make this forecast based on a suitable combination of technical and fundamental analysis, since it will usually be for a fairly long time frame.
  • Leverage Risk
An important risk factor for retail forex traders to consider with the carry trade is that if substantial leverage is used to implement it, then sharp unfavorable market movements could result in losses that may prompt margin calls or the position being automatically stopped out by your forex broker.
  • Interest Rate Shift Risk
When carry traders seek to compound their interest on a monthly or even daily basis to increase their overall returns, they can then be subject to returns that can vary depending on movements in the interest rate differential.
For example, if the interest rate differential widens, this will generally be a move in the carry trader's favor, which they can take advantage of in the next compounding period.
On the other hand, when interest rate differentials narrow, the carry trader will then receive a lower return than anticipated in their next interest compounding period.


How Professional Strategic Forex Traders Operate

How Professional Strategic Forex Traders Operate


Those who have arrived at the enviable position of being a professional strategic forex trader for a major international bank or hedge fund tend to focus on taking advantage of longer term moves in the forex market.
Such strategic traders, who often form part of the management of a currency trading operation, can also take positions overnight in just about any liquid currency pair they like for as long as they like within certain risk management parameters.
What Qualifies a Strategic Forex Trader
To attain this rather elevated position in a forex dealing room, you will not only need to have amassed considerable experience trading in the forex market under a variety of conditions, but you must also usually have achieved a good track record of reliable profitability when dealing forex.
In the case of bank traders, such a profitable trading history will need to be based more on your consistent ability to forecast exchange rates well than on your ability make money by trading off of customer business and orders.

Focal Points for Strategic Traders

Strategic traders do not generally have to focus on intra-day fluctuations in just one currency pair, like many professional forex market makers and scalpers do. Instead, they typically use a reliable combination of technical and fundamental analysis to arrive at a trading scenario that has a high probability of success in terms of its profitability for their employer.
They can also plan on having their positions benefit from favorable interest rate differentials and compound interest just like carry traders do, since their positions will often be held for some time.

How Strategic Traders Plan Their Trades

Strategic traders generally carefully plan any positions they consider taking, and often consult with currency charts to determine optimum short term entry and exit points based on support and resistance levels.
Furthermore, they will usually manage their risk with stop losses and will aim to achieve a certain realistic take profit level. This will give them an easily-calculated initial risk reward ratio for the trade where the risk is the number of pips from their entry point to their stop loss level, while their possible reward is the number of pips to their take profit level.
Not only should their strategic trades be planned in such as way as to show a high probability of success, but their trades should have a risk reward ratio that makes their rewards as at least twice as large as the risk they will be taking.

What Strategic Traders Do With Open Positions

Once a strategic forex trader has initiated a position, they will then usually enter their intended stop loss and take profit orders into the market in strict accordance with their trade plan. They then wait until either order is executed to assess the outcome of their trade.
Some strategic traders working at major financial institutions will use call levels in place of orders where they receive a phone call at any time of the day or night if the market is approaching their intended stop loss or take profit levels so that they can better assess the market at that time.
Furthermore, some such traders will trail their stops by putting them at more favorable rates when the market moves in the direction that results in profits accruing on their position. This trailing stop strategy is often used to follow trends and protect accumulated profits.